


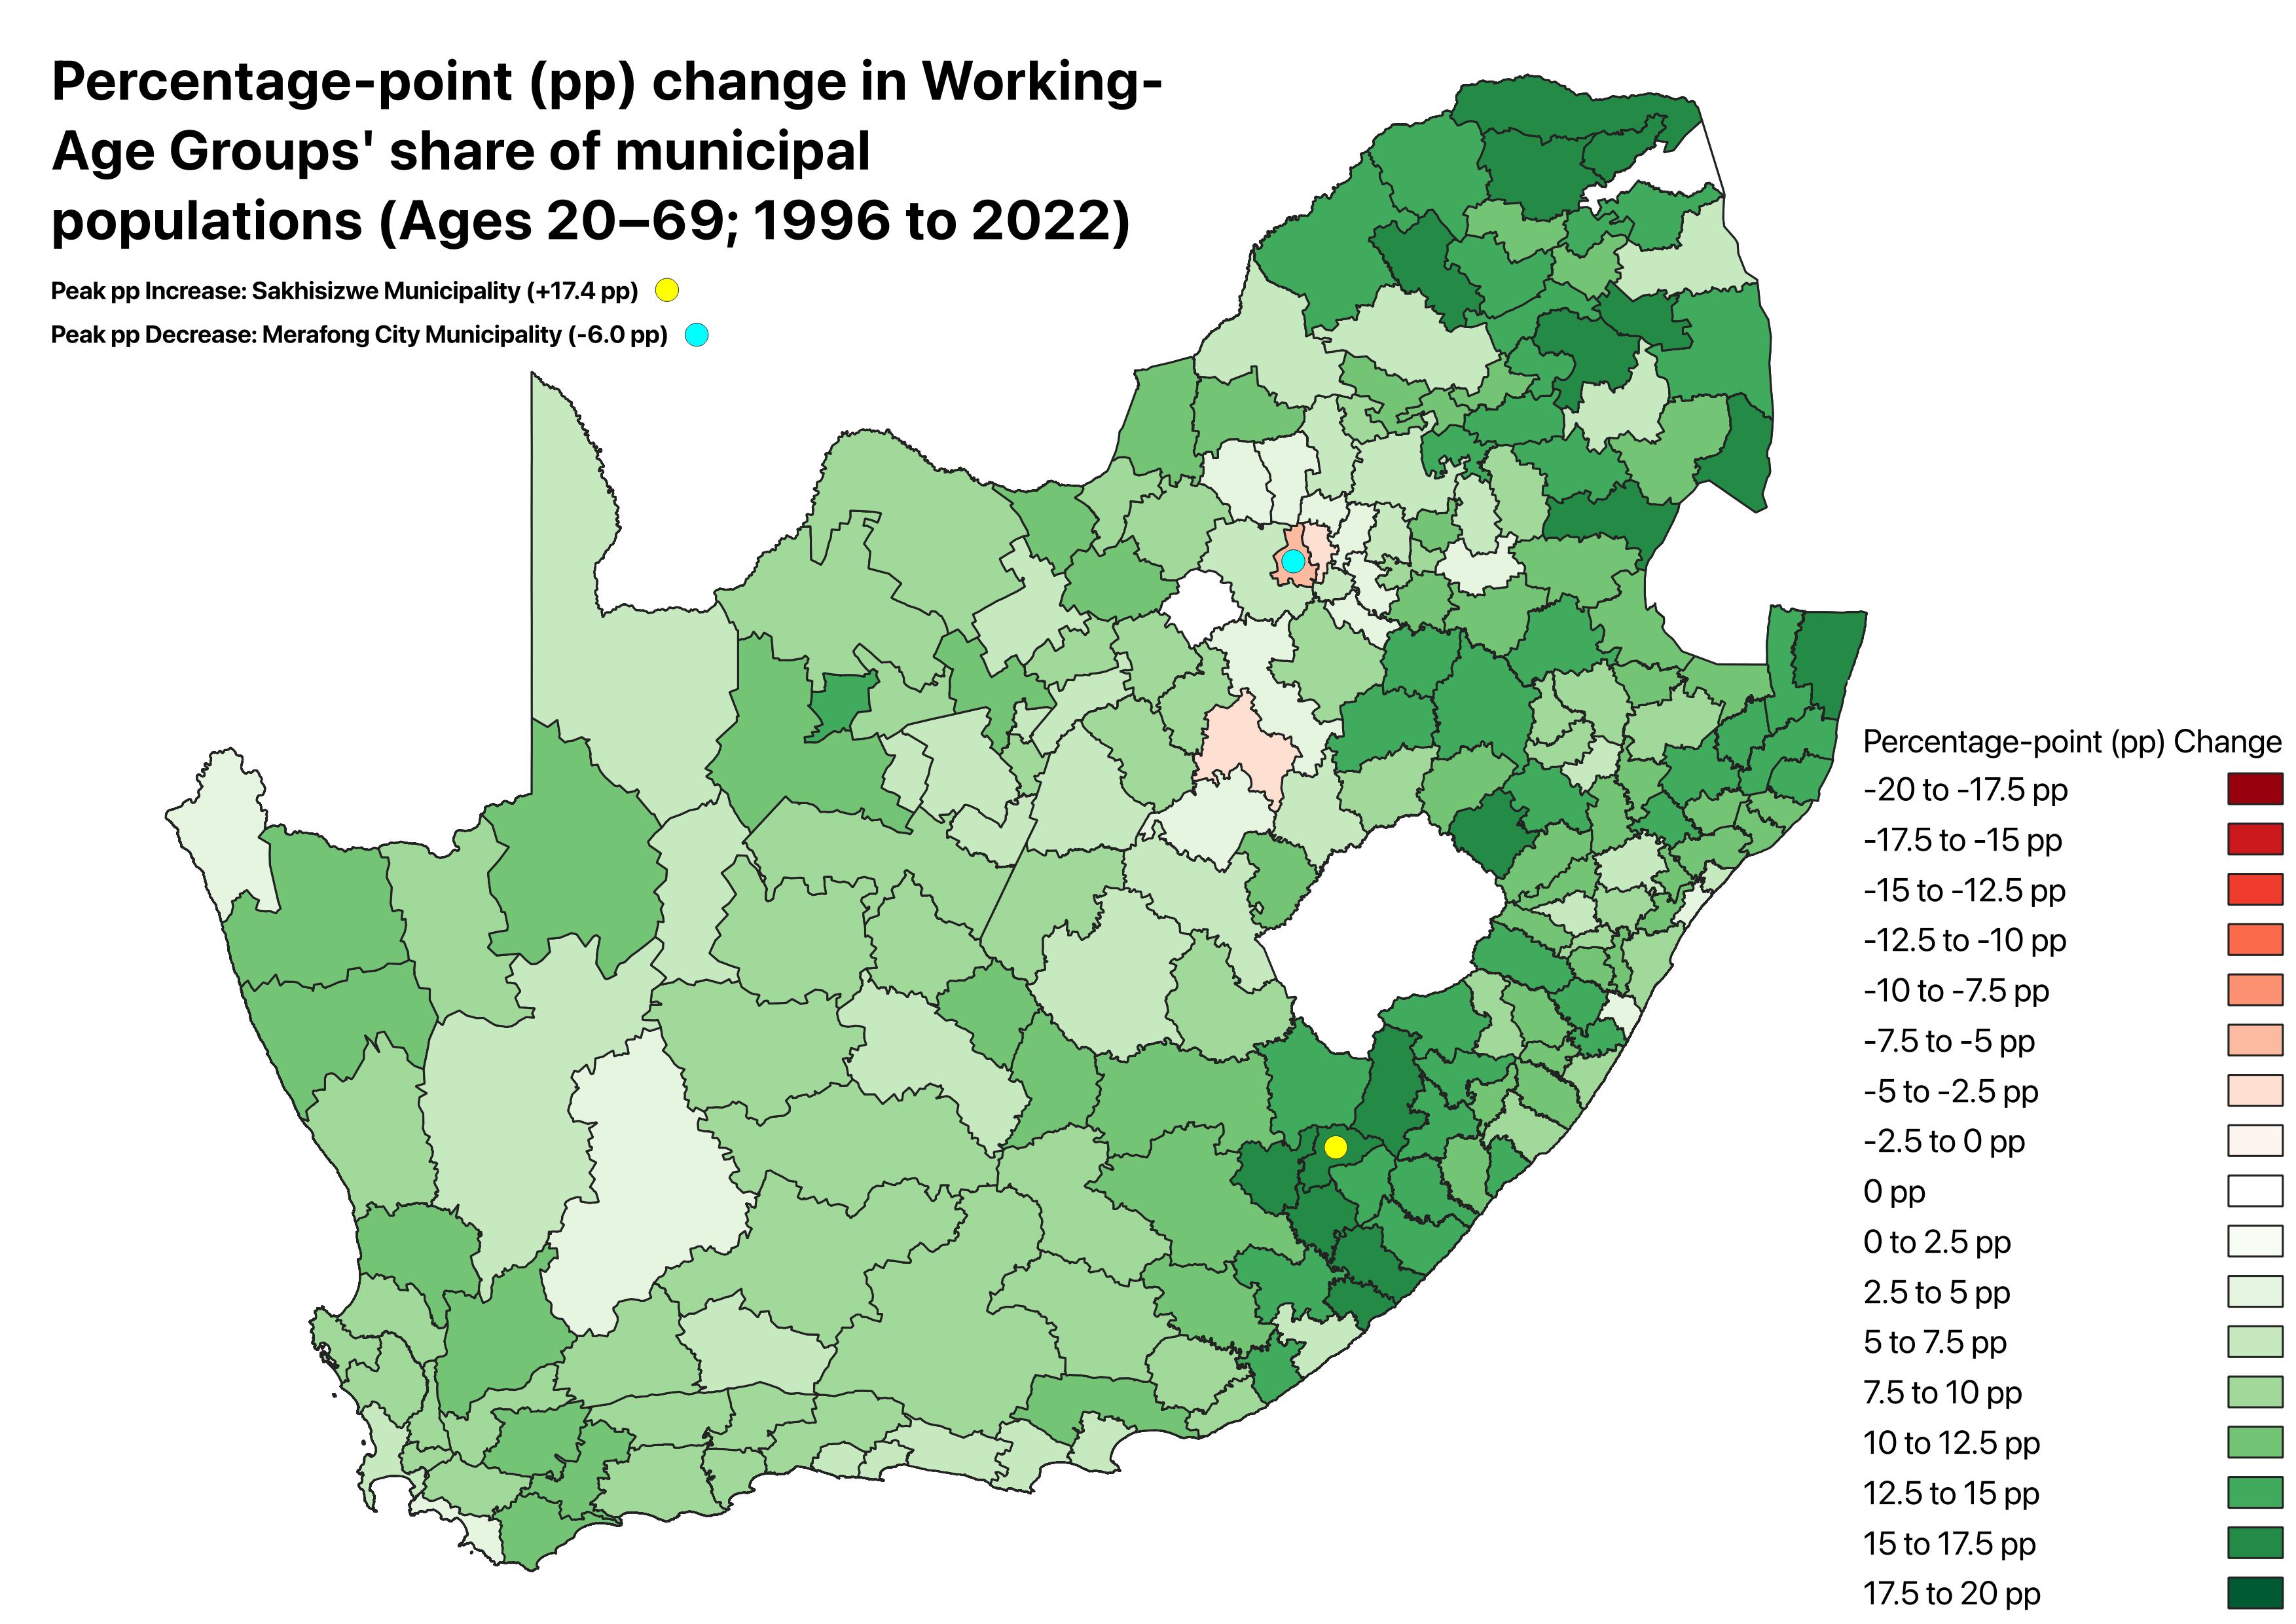
The census data spanning three decades reveals a country undergoing significant demographic transformation, with implications for policy, service delivery and economic planning.
Key Population Trends (1996–2022)
The population grew at an average annual rate of 1.7% over the 26-year period. Notably, the country has become slightly more female, with women now constituting 51.5% (31.9 million) of the population in 2022.

Provincial shifts have been dramatic. Gauteng overtook KwaZulu-Natal as the most populous province in 2011 and by 2022 its population exceeded 15 million. The Western Cape climbed from fifth to third-most populous province, displacing both the Eastern Cape and Limpopo. The Free State and Northern Cape have consistently remained the least populated provinces.
Age Structure: The Aging of a "Youthful" Nation
While South Africa remains a youthful country—with just over 21.6 million people aged 15–34 in 2022—the data shows a clear aging trend. The proportion of children (0–14) has grown at the slowest rate (0.7% annually), while the elderly population (65+) has seen the fastest growth at 3.0% per year.
The median age has increased from 22 years in 1996 to 28 years in 2022—an overall increase of six years. This represents a fundamental shift in the population structure.
Provincial pyramids tell different stories:
- Limpopo still shows a typical pyramid shape with a broad base, though it has narrowed since 1996, indicating a growing working-age population.
- Gauteng displays a narrow base and bulging middle for both periods, reflecting economic migration of working-age adults into the province.
Population Groups and Language
Population group composition has shifted significantly:
- Black Africans increased from 77% (1996) to 81.4% (2022)
- White population declined from 11% to 7.3%
- Coloured population constituted 8.2% in 2022
- Indian/Asian population remained below 3%
Language dynamics show:
- IsiZulu remains the most spoken language at home (24.4%), followed by isiXhosa (16.3%) and Afrikaans (10.6%)
- Afrikaans speakers declined from 14.5% in 1996 to 10.6% in 2022
- Sign language, now South Africa's 12th official language, was used by less than 1% of the population in both 2011 and 2022
Demographic Dividend and Dependency Ratios
The most significant finding is the decline in dependency ratios, from 64.4% in 1996 to 48.8% in 2022. This represents a demographic dividend—an expanding working-age population relative to dependents.
This shift was driven primarily by:
- A substantial reduction in the child dependency ratio (56.4% to 39.2%)
- A modest increase in old-age dependency (7.9% to 9.6%)
The pattern is consistent with a demographic dividend characterized by a growing working-age population relative to dependents—a critical opportunity for economic growth if properly harnessed through education, job creation and social investment.
Issued by Stats SA








Comments (0)
No comments yet. Be the first to share your thoughts!